─ Net revenues decreased 12% over Q4 2008 to NT$ 4,915 million (US$143.8million)
─ Operating income decreased 27% over Q4 2008 to NT$ 772 million (US$22.6 million)
Hsinchu, Taiwan, R.O.C. – Macronix International Co., Ltd. (TSEC: 2337) today announced the unaudited financial results for the first quarter ended March 31, 2009. All numbers were prepared in compliance with the R.O.C. GAAP on an unconsolidated basis.
Summary of the First Quarter 2009:
Total net revenues decreased 12% sequentially and increased 0.1% over first quarter 2008 to NT$4,915 million (US$143.8 million).
Gross profit was NT$1,776 million (US$ 52.0 million) with 36% gross margin.
Operating income decreased 13% from NT$892 million in first quarter 2008 to NT$772 million (US$22.6 million).
Income before tax was NT$666 million (US$19.5 million); Net income was NT$624 million (US$ 18.3 million).
EPS was NT$0.20; book value per share was NT$12.06.
Capacity utilization rate was 47%
First-Quarter 2009 Financial Highlights:
Revenue was NT$4,915 million and gross profit NT$1,776 million
Net income decreased to NT$624million with EPS NT$0.20
Revenues
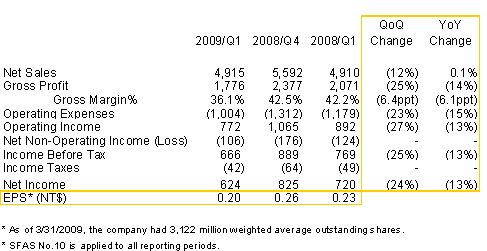
The Company announced the first quarter net sales revenues of NT$4,915 million (US$143.8million), a 12% decrease sequentially and increase of 0.1% year- over-year. The sequential revenue decrease was a result of seasonal gliding demand for all product lines and economy downturn.
Gross Profit and Gross Margins
Gross margin for the first quarter 2009 was 36%, lower than 42% in the first quarter 2008 and 43% in the fourth quarter of 2008 due to lower utilization rate. Gross profit was NT$1,776 million (US$ 52.0 million), a decrease of 14% year-over-year, and decrease of 25% sequentially.
Operating Expenses and Operating Income
Operating expenses for the first quarter were NT$1,004 million (US$29.4 million), a decrease of 15% year-over-year and a decrease 23% sequentially. Operating income for the first quarter was NT$772 million (US$22.6 million), compared to NT$1,065 million in the fourth quarter of 2008 and NT$892 million in the first quarter of 2008.
Non-operating Income and Expenses
Net non-operating loss was NT$106 million (US$3.1million) for the quarter, consisting of net interest income of NT$59 million (US$1.7 million), recognized investment loss of NT$135 million (US$3.9 million), gain on disposal of fixed assets of NT$1 million (US$0.03million), net foreign exchange loss of NT$62 million (US$1.8 million), and the net other gain of NT$31 million (US$0.9 million)
Net Income and EPS
Net income before tax was NT$666 million (US$19.5 million), compared to NT$889 million in the fourth quarter of 2008 and NT$769 million in the first quarter of 2008. For the first quarter of 2009, the estimated tax provision was NT$42 million (US$1.2 million) and the net income after tax was NT$624 million (US$18.3 million). EPS was NT$0.20 (US$0.006), compared to NT$0.26 in the fourth quarter of 2008 and NT$0.23 in the first quarter of 2008. The book value was NT$12.06 per share.
Balance Sheet
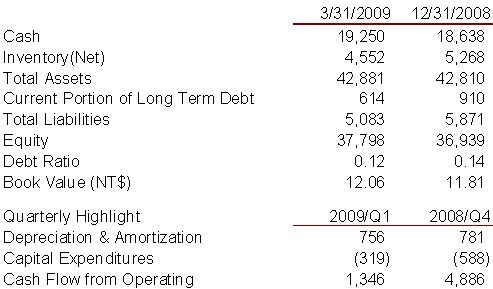
Macronix has strong cash position. The debt-to-asset ratio is now 0.12 which is lower than 0.14 in the fourth quarter of 2008. As of March 31, 2009, the Company had NT$19,250 million (US$563.2 million) in cash and cash equivalents. Net inventory decreased by NT$716 million (US$20.9 million) to NT$ 4,552 million (US$133.2 million), compared to NT$5,268 million for the fourth quarter of 2008.
The total liability decreased to NT$5,083 million (US$148.7 million), a decrease of NT$788 million (US$23.1 million), compared to NT$5,871 million at the end of December 31, 2008. Shareholders’ equity was NT$37,798 million (US$1,105.9 million). Depreciation and amortization expenses were NT$756 million (US$22.1 million) for the quarter, a decrease of NT$25 million (US$0.7 million), compared to the fourth quarter of 2008. Cash flow from operations was NT$1,346 million (US$39.4 million) in the quarter. Capital expenditure for the quarter was NT$319 million (US$9.3 million) mainly for the upgrade of production equipment
Business Highlights
ROM and Flash Counted 54% and 40% of the Net Sales Respectively
Sales in the fourth quarter from ROM revenue accounted for 54% of net sales, an increase of 10% year-over-year and a sequential decrease of 25%. The unit shipments of ROM decreased 8% year-over-year and decreased 31% sequentially.
Flash products accounted for 40% of net sales, an increase of 5% year-over-year and a sequential increase of 19%. The unit shipments of Flash increased 29% year-over-year and increased 26% sequentially.
Sales in FBG products (formerly named as SMS) accounted for 6% of net sales, a decrease of 51% year-over-year and a sequential decrease of 22%.
Capacity Utilization Rate was 47%; Products of the Advanced Process Technology Kept at Higher Percentage
In first quarter of 2009, the products made by 0.15 um, 0.13 um, 0.10 um and 75nm of the advanced process technology collectively accounted for 91% of net sales, which is higher than 88% of net sales in 2008Q4. The main reason is that 75nm technology product revenue is higher than in 08Q4. Capacity utilization rate decreased to 47% from 93% year-over-year, and decreased from 69% in the previous quarter.
2009Q2 Outlook
Compared with first quarter 2009, management’s expectations for second quarter 2009 performance are as follows:
Total unit shipment will be +25% to +30 %;
ASP (blended) will be -15% to -20%;
Gross profit margin is expected to be 36% to 38%;
Capacity utilization rate is expected be 85% to 90%
Quarterly Income Statements
Unit: NT$ million (except EPS)
* For details, please refer to the audited financial reports of Q109.
Balance Sheet / Cash Position
Unit: NT$ million
Safe Harbor Statement
The statement contains certain forward-looking statements with respect to the results of operation, financial condition and current expectation. The forward-looking statements are subject to known and unknown uncertainties and risks that could cause actual results to differ materially from those expressed or implied by such statements.
Such risks and uncertainties include but are not limited to the impact of competitive products and pricing, timely design acceptance by our customers, timely introduction of new technologies, ability to ramp new products into volume, industry wide shifts in supply and demand for semiconductor products, industry overcapacity, availability of manufacturing capacity, financial stability in end markets, and other risks.
The forward-looking statements in this release reflect the current belief of Macronix as of the date of this release and Macronix undertakes no obligation to update these forward-looking statements for events or circumstances that occur subsequent to such date
About Macronix International Co., Ltd.
Founded in 1989, Macronix International Co., Ltd. (TSE: 2337.TT) is a leading provider of innovative Non-Volatile Memory (NVM) solutions. Macronix is the largest worldwide manufacturer of ROM products, and also provide wide range of NOR Flash products across various densities for system embedded, consumer, communication and enterprise applications.
For more information, please visit the Company’s web site at www.macronix.com.
Contacts:
Michelle Chang
Macronix International Co., Ltd.
Public Relations
+03 578 6688 ext. 71233
michellechang@mxic.com.tw
Douglas Sun
Macronix International Co., Ltd.
Finance Center / Investor Relations
+03 578 6688 ext. 76632
douglassun@mxic.com.tw